GoJS - Interactive JavaScript Diagrams for the Web
GoJSis a JavaScript and TypeScript library for building interactive diagrams and graphs
From simple flowcharts and org charts to highly-specific industrial diagrams, SCADA and BPMN diagrams, medical diagrams such as genograms and outbreak modeling diagrams, and more. GoJS makes constructing graphs of complex nodes, links, and groups easy with customizable templates and layouts.
GoJS offers advanced features for user interactivity such as drag-and-drop, copy-and-paste, in-place text editing, tooltips, context menus, automatic layouts, templates, data binding and models, transactional state and undo management, palettes, overviews, event handlers, commands, extensible tools for custom operations, and customizable animations.
We maintain hundreds ofsample diagrams, detailing different examples of interactivity, templates, and user logic for you to start from. We offer free developer-to-developer support during evaluation.
Flowcharts
Build interactive flowcharts or flow diagrams. Let your users build, modify, and save Diagrams with JSON model output.
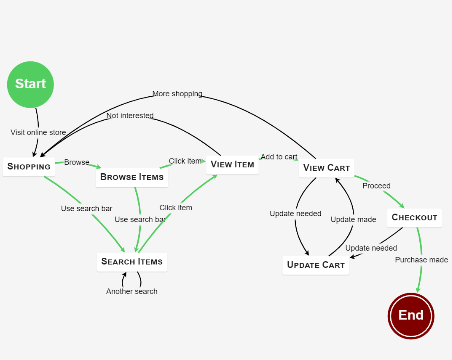
State Charts
Visualize State Charts and other behavior diagrams. Create diagrams with live updates to monitor state, or interactive diagrams for planning.
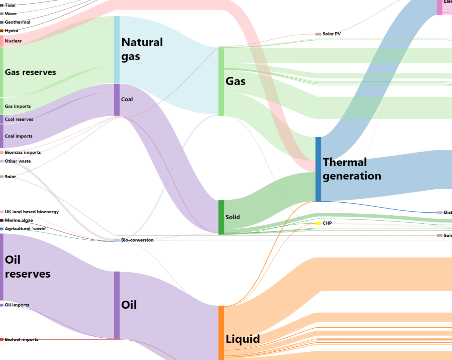
Sankey Diagrams
GoJS allows considerable customization of Links and Nodes to build all kinds of diagrams. Visualize flow, or connect pipes
Genogram Diagrams
Create Genogram and Medical diagrams, or editable family trees with collapsible levels.
Org Charts
Create classic org charts for viewing or editing. Automatic layouts make different visualization options easy.
Dynamic Ports
Dynamically add ports and custom link routing. Use data-bindings to save and load routes within the Model JSON.
Industrial Processes
Model industrial processes, workflows, SCADA diagrams and more. Permissions and validation make it easy to add rules and constraints when your customers build diagrams.
Dynamic Grouping
Use groups as containers and subgraphs, with group members bounds by their own rules and layouts.
8. 역시, 외부 라이브러리!상용 or 오픈소스? 상용 → 결국 비용의 문제 라이센스 비용 부담 (ex. Highcharts 10 developer $3,320) 오픈소스 → 어떤 라이브러를 사용할 것인가? 결정의 어려움 (많은 고려요소 필요)
9. 다양한 차트 라이브러리어떤 것을 선택할 것인가? [참고] https://bestof.js.org/tags/chart
10. 기술 선택 가이드 성능 중요(빠른 대용량 데이터 처리), 상대적으로 디자인은 덜 중요한 경우 → Canvas (비트맵) 디자인 및 요소별 커스터마이징, 다양한 해상도(Zoom) 중요 → SVG (벡터) [참고] SVG 대 캔버스: 선택 방법
11. 영역별 다른 관점, 디자인 보단 실시간 변화 표현 중요 대용량 트래픽의 실시간(realtime) 변화 확인 수치의 변화가 중요. 기본 디자인 사용에 문제 없음 관리도구 등에 적합. 소수의 참여자(admin)
12. 영역별 다른 관점, 엔드 유저대상, 다양한 디자인/UX 중요 주로 정적인 데이터의 시각화 디자인과 UX 적용의 유연성 필요 대규모의 불특정 사용자(엔드유저)를 대상
13. 그간 네이버에서의 차트서비스들마다 다른 라이브러리를 사용 그리고 그로 인한 다양한 문제
14. 문제들 기술적 know-how 축적 안됨 상용 라이브러리 사용시 비용 문제 경험이 누적되지 않아 차트 적용(디자인/개발)시, 매번 반복되는 리소스의 낭비
15. 물론, 처음엔 자체 개발 그러나, 성공적이진 못했다. 서비스 적용 이후, 메인터넌스 잘 안됨 개발 주체의 부재상황(이직 등) 또는 다른 서비스 개발 등으로 인한 지원 어려움 타 라이브러리 대비 범용성 부족
16. 그렇다면 오픈소스 사용은 어떨까? 지속적 업데이트, 기술적 트렌드 반영, 안정성 등을 기대할 수 있으니 합리적이지 않을까? 향후 오픈소스 업데이트 지속되지 않을 경우, fork를 통한 유지 고려도 가능 공통된 라이브러리를 사용하면, 각각 다른 라이브러리 사용으로 인한 관리 및 기술경험 누적되지 않는 이슈 해결 기대 [참고] 그간 사용되었던 다양한 차트 라이브러리들: , , , , , etc.NVD3 C3.js Chart.js Highcharts echarts
17. 직접 개발도 해봤고, 외부(상용/오픈)의 것도 사용해 봤으니 간접적인 형태로 접근해 보자 라이브러리의 발전은 생태계에 맡기자. 필요한 기능은 PR을 통해 해결 오픈소스는 일정 수준 검증 되었다. 다양한 문서, practice가 존재한다.
18. 그래서, 만들다. C3.JS 확장 라이브러리 개발
19. C3.JS 선정이유 가장 인기있는 D3.js 기반 한정 Popularity 비교: → GitHub star, 써드파티 앱, StackOverflow 질문 수, etc. 간결한 인터페이스 풍부한 문서, 예제 등 → 구글검색 결과: C3.js(22만) Vs. NVD3(6만4천) 네이버 서비스들에서 이미 다수에서 사용 엔드 유저 대상이므로, 디자인/기능 커스터마이징 용이성 중요
20. 개발 시작 고난의 시작
21. 개발시 겪게 되는 문제들 커뮤니케이션 디자인 & 인터렉션 커스터마이징 그리고 또 그리고 수많은...
22. 커뮤니케이션나의 이름은 무엇 인가요? 차트 개발 경험이 많이 없는 경우, 부르는 명칭도 제각각
23. 디자인 가이드 각 요소들의 크기와 위치를 가이드에 맞춰주세요.
24. OMG! SVG TEXT I'm SVG text 텍스트 스타일링은 가능 <br> 같은거 안됨. 줄바꿈은 새로운 노드로 위치(via attributes) 여백 등의 조정이 어려움 → transform:translate 또는 <tspan> 사용
25. 모바일 환경 C3.js는 모바일 환경 미지원 Swipe 제스처를 통한 데이터 확인 UX 필요
27. 최소값y축 기반 값에 따른 up/down 표현 0 1 2 3 4 100,000 100,500 101,000 101,500 102,000 102,500 103,000 103,500 104,000 0 1 2 3 4 0 10,000 20,000 30,000 40,000 50,000 60,000 70,000 80,000 90,000 100,000 110,000 위의 차트는 모두 동일한 값을 표현하고 있습니다.
28. 데이터는 없지만, 데이터는 표현해야 한다? 데이터가 0인 경우, 표현이 되어야 할까? 안되어야 할까?
29. C3+ C3.JS 확장 라이브러리를 만들다.
30. C3+? C3.js를 확장한 테마 형태의 디자인 차트 생성 C3.JS: 확장 + 기능 보완 + 테마 커스텀 축 지원 범례 템플릿 모바일 지원 테마를 통한 차트 생성 확장 옵션
31. 블로그/포스트 통계 적용[네이버 블로그] 블로그 통계가 새로워졌습니다! [네이버 포스트] 훨씬 좋아진 통계, 지금 제공합니다!
32. C3+ GOAL 매번 다른 기술/라이브러리를 다루는 반복적인 비용 제거 기본적 디자인(테마)을 활용해 커스터마이징(디자인)에 따른 비용 제거 기술적 경험 축적: SVG, D3, C3.js
33. BUT, 현실적 문제직면 장기적 관점에서, C3+ 발전을 위해 외부 공개 목표 하지만, 래퍼/애드온 형태의 지속적 발전과 효용성 의문 기반 라이브러리인 C3.js 지속성 의문 오픈소스의 발전에 기댈 수 있을 것이란 기대는 C3.js의 더딘 발전(또는 중단?)으로 위기 직면
34. Re-usable, easy interface JavaScript chart library based on D3 v4+
35. 차트를 만들어 봅시다.
36. STEP 1 파일을 로딩 합니다.<!-- D3.js를 로딩 --> <script src="https://d3js.org/d3.v4.min.js"></script> <!-- billboard.js와 기본 스타일을 로딩 --> <script src="billboard.js"></script> <link rel="stylesheet" href="billboard.css">
37. STEP 2 차트가 노출될 영역을 설정합니다. <div id="chart"></div>
40. 커스터마이징150개 이상의 제공 SVG 노드: 필요한 경우, 직접 핸들링 가능 CSS로 스타일링 가능 다양한 옵션
41. THE UNKNOWN WAY TO FORK에서 공개까지
42. C3.JS 프로젝트 참여 시도원 개발자 및 커미터에게 메일을 통한 문의
43. 일단 활동하자PR도 보내고 이슈들에 대한 답변도 하고 [참고] https://github.com/c3js/c3/issues/1924#issuecomment-271224192
44. 그렇게 몇 주가 흘렀지만 메일 회신도 없고, 프로젝트 ACTIVITY도 딱히 없는 상태...
45. 공개적 문의issue를 등록해 공개적으로 프로젝트 유지 문의 [참고] https://github.com/c3js/c3/issues/1965
46. 그리고, 그 다음날
47. 그래, FORK 하자'향후 오픈소스의 업데이트 지속 안될 경우, fork를 통한 유지'의 명제 당면한 C3.js의 미해결 과제들: D3 최신버전 v4+ 미지원 모바일 환경에 대한 지원 부족 오래된 개발 스타일 코드 (ES3) SVG polyfill 제거 등등...
48. 합리성, 당위성 & 신뢰 Fork 한다고 해서 사용자가 오진 않는다. 기존 커뮤니티에 당위성이 제시 필요 과연 이 사람(개발자)이 믿을만 한가?
49. THE JOURNEY GOING FROM D3 V3 TO V4 WITHIN TWO MONTHS
50. OOPS~, D3 V4v3 → v4: Breaking Changes 공식 문서( ) 있으나, 마이그레이션 가이드 없고 만들지 않을거임. Changes in D3 4.0 [참고] https://github.com/d3/d3/issues/2893 D3 V4 - What's new?
51. D3 V4로 업그레이드변경된 모듈에 대한 목록을 모두 작성 v3 v4 d3.time.scale d3.scaleTime d3.svg.line() d3.line d3.behavior.drag d3.drag ... 모듈의 behavior 변경되어, 기존과 유사한 것도 있지만 다르게 처리되는 것들이 대다수 이전 버전과 변경된 문서를 읽고 비교하고, 테스트 하고...
52. 그외 작업들 차트 생성 흐름에 따른 오류들의 순차적 해결/변환 ES3 → ES6로 전환 병행 및 개발 환경 변경 API 문서화 ( ) 테스트 코드 업데이트(d3 v4 호환) 및 커버리지 개선 JSDoc
53. RELEASE 3주전 YAY~!, 이제 끝이 보인다.
54. 어느 날, 갑자기 두둥~ 갑작스러운 C3.js 차기 릴리즈 계획과 새로운 커미터 추가 [참고] https://github.com/c3js/c3/issues/2033
55. 고민이미 많은 진전을 통해 릴리즈를 앞둔상황 계획만을 통한 발전에 대한 의문 커미터 추가 후에도 활발한 활동 없어, 빠른 시일 내 D3 v4 지원 어렵다는 판단 계획대로 릴리즈 하자.
56. 오픈소스 네이밍원래는 C3+ 2.0으로 계획, 그러나 C3.js 연관성의 부정적 의견 'billboard'는 음악 차트 의미는 다르지만 '차트'를 연관 오랫동안 친숙한 이름 FE 프로젝트에서는 기 등록된 npm 모듈명 확인 필요 [참고] Open Source Project Name Checker
57. RELEASE!2017년 6월8일, v1.0.0 공개
58. 그러나, 공개한다고 갑자기 관심과 사용자가 몰려오진 않는다. 홍보전략 필요
59. 직접 발로뛰기 다수의 'ECHO' 사이트에 등록하기 JavaScript Live Echo JS Hacker News 많은 곳에서 해당 사이트에 등록된 정보를 활용, 재전파 한다.
60. 뉴스레터 소개 요청하기 JavaScript Weekly [참고] FE 관련 뉴스레터는 사실, 한 곳에서 발행 https://cooperpress.com/
61. 유력 매체 소개 JavaScript Weekly 소개 JavaScript Daily 소개
62. GITHUB TRENDING!JavaScript 언어부문 3위 기록 [참고] https://github.com/trending/javascript
63. GITHUB STAR 공개 후, 첫 6일간 700개 14일 후, 1,000개 도달! Star의 가치는? cdnjs 등록은 최소 200개 요구됨 Vuejs도 첫 6일간 615개 How I Got From 0 to 1 000 Stars on GitHub in Three Months
71. 신규 옵션들과 문서 C3+ 경험들을 통한 신규 옵션 꾸준한 문서 업데이트 API는 한번 작성되면 끝이 아니다. 정확한 의미와 동작을 기술 그리고 지속적 업데이트
72. 오픈소스의 중요한 요소들 안정성, 충분한 문서 그리고 책임감 [참고] http://opensourcesurvey.org/2017/
73. 오픈소스의 어려움누군가의 노력이 대가없이 제공되는 것. 그러나, 쉽게 비난 받기도 한다. https://twitter.com/spf13/status/907403135592878080
74. 의연하게 대처하기 You shouldn’t let strangers on the internet negatively affect your mood or your drive ... The trolls feed on your annoyance and discourse. ― Sindre Sorhus [참고] Between the Wires: An interview with open source developer Sindre Sorhus 1,139 npm Packages
75. WHY DO OPEN SOURCE? 세상에서 내가 도움 받은 것에 대해 다시 기여하는 의미있고 가치있는 행동 [참고] 네이버 오픈소스 가이드 GitHub Open Source Guides
76. SPECIAL THANKSMASAYUKI TANAKA AND ALL OF THE C3.JS CONTRIBUTORS, FOR YOUR GREAT EFFORTS AND WORKS TO THE COMMUNITY!
The OFCGWT project provides a simple to use chart widget for GWT based on
Open Flash Chart 2. The library includes the needed flash insertion, update and
manipulation methods for the chart widget. It also includes a POJO model for the
chart elements and components that assist in the generation of the JSON to
provide the correct chart data for OFC 2.x API.
The project has released a beta of version 2.x and a stable 1.3.x release -
with over 12,000+ downloads !!
Note: A beta of v2.0 (GWT 1.6 support) does contain breaking
API for those coming from the 1.X version of OFCGWT - it contains new refactored
events and a new chart factory, better attach/detach support, new charts
features(new Horizontal Stack Bar Chart, enhanced animations based on OFC Ichor
with DZ fixes and patches).
ECharts is a comprehensive charting library that supports line, column, scatter, radar, candlestick, chord, gauge, funnel, map, and force-directed chart types. It works even if you have tons of data, and can chart 200,000 data points on a Cartesian chart almost instantly.
기존의 상용 차트 라이브러리와 오픈소스 차트 라이브러리는 다양한 종류의 차트를 구현할 수 있지만 데이터를 시각적으로 표현하는 데만 중점을 둡니다. 그렇기 때문에 스크린 리더 등의 보조 기기로 차트에 접근하면 스크린 리더가 차트 자체를 이미지로 판단해 전달하려는 실질적인 데이터는 읽을 수 없습니다.
네이버에서 차트 라이브러리를 개발하게 된 계기는 네이버 사이트의 접근성 현황을 효율적으로 표현할 방법이 필요했기 때문입니다. 지침별 수준을 수치화하는 폴리곤 모양의 레이더 차트가 필요하다고 판단하여 오픈소스 기반의 차트를 사용하려 했습니다. 그러나 원하는 정보를 표현할 수 있는 차트를 제공하는 라이브러리를 찾지 못해 내부에서 직접 차트 라이브러리를 개발하기로 결정했습니다.
개발 초기에는 폴리곤 형태를 표현할 수 있는 레이더 차트의 개발만 염두에 두었습니다. 이후 다른 형태의 정보를 효율적으로 표현할 수 있는 Polar Pie 차트, 비교 차트 등 기존의 라이브러리에서 찾아볼 수 없는 여러 형태의 차트를 추가해 종합 차트 라이브러리인 Nwagon(http://html.nhncorp.com/nwagon)을 개발했습니다. 그리고 여러 곳에 널리 사용되기를 바라는 마음으로 Nwagon을 NULI 사이트(http://html.nhncorp.com)에 오픈소스로 공개했습니다.
'Nwagon'이라는 이름은 접근성을 뜻하는 'web accessibility'와 라이브러리 개발의 계기가 된 'polygon'의 'gon'을 조합해 만든 이름입니다. 이름이 뜻하는 대로 추가 작업이 없어도 차트를 볼 수 없는 사용자들에게 동일한 정보를 제공할 수 있도록 접근성을 향상시킨 차트 라이브러리입니다.
네이버 서비스의 접근성 현황을 표현하기 위한 방법 모색 중, 지침별 수준을 수치화 하는 폴리곤 모양의 레이다 차트 구현의 필요성을 기반으로 nWagon 차트 개발은 시작되었습니다.
개발 전 고려된 무료기반의 라이브러리들은 저희가 필요로 하는 필수 기능들을 표현한 사례가 없었고, 이를 위해 간단하면서도 사용하기 쉬운 자체 차트 라이브러리를 개발하게 되었습니다. 차트의 이름은 차트 개발의 시발점이 된 Web Accessibility의 약자인 WA와 차트의 모티브가 된 폴리곤의 gon을 조합한 wagon으로 네이버의 N과 결합하여 최종 이름을 nWagon으로 명명하였습니다. 더불어, 마차(wagon)을 탄 것과 같이 편한하게 웹 서비스를 이용할 수 있도록 하기 위한 저희 접근성팀의 열정을 담고 있기도 합니다.
Key Points
손쉬운 사용
JSON 형태로, 라이브러리 사용시 한번의 function call만으로 차트가 완성되는 용이성
간결한 디자인
컬러와 크기 등 조절의 간편함
빠른 속도
SVG를 이용하여 랜더링 속도가 빠르며 DOM을 이용한 event나 CSS Selector 적용 가능
크로스브라우징
IE9를 포함한 주요 브라우저 지원 가능(Chrome, Firefox, Safari, IE since v.9)
This article is basically your guide to the most popular and an effective JavaScript toolkit for creating charts and graphs. We will give you an overview of what these toolkits can actually do for you. If you are a developer, I am sure you have find yourself repeating some old cold again and again. If this happens with you more than often, toolkits are absolutely perfect for you. This article is basically intended to help JavaScript developers so that they can make their work a lot simpler.
These toolkits will definitely simplify your work when it comes to development and that too in a lot of ways. These toolkits are also known as frameworks and some call them libraries however, name doesn’t really matter. The best part is that they are meant to ease the tasks of a developer and make things productive. Let us now take a look at the JavaScript Toolkit for creating charts and graphs.
FusionCharts Suite XT – JavaScript Charts for the Grown-ups
Demo || Download FusionCharts Suite XT gives you delightful JavaScript charts that work across devices and platforms. It’s the most comprehensive solution out there with 90+ chart types, complete with interactive features like tool-tips, drill-down, zoom, scroll, and more. It comes with comprehensive docs, and readymade demos, allowing you to create your first chart in under 15 minutes.
Aristochart is definitely one of the best toolkits available for creating charts and graphics. The best thing is that is can be customized and is very flexible line charting library. Your focus can remain on aesthetic and Aristochart can take care of the backend data. It also offers a wide range of themes for your selection.
Morris.js is one of the most effective JavaScript toolkits. It is basically a library that controls the graphs. Morris.js is a simple API and it is for drawling line, bar, area and of course donut charts. You will find how convenient this is after using it.
JKit, is definitely an easy to use toolkit. It is a cross platform and jQuery based toolkit. Although its small in size but will offer you all the needed features. It makes life simple and removes complications from the development process.
if you are looking to manipulate documents according to data, D3.js JavaScript’s library is the best option for you. It will help you in bringing your data to life with the help of HTML, SVG and CSS. The best thing is that it does not tie you to proprietary framework.
Rickshaw – JavaScript toolkit for creating interactive time series graphs
if you are looking to create interactive graphs, Rickshaw will provide you with all the needed elements. Since it is all based on d3 underneath, you will be able to draw graphs with SVG and styles with CSS. You can also customize your own techniques and the best thing is that it is free and open source.
sDashboard – Simple & light weight Dashboard framework in jQuery
sDashboard is basically a jQuery plugin and it converts assorted objects into a dashboard. Every object that has been converted will be rendered as a widget and a developer can drag it. This plug-in has built in support for interpreting datatable’s and flotr3 charts. It also offers a lot of other features that can simplify your life.
Highcharts – Interactive JavaScript charts for your webpage
This is basically a charting library and is written totally in pure JavaScript. This will offer you interactive charts for your website. Highcharts supports most of the chart types and it includes line, spline, column, bar and a lot more.
jqPlot – A Versatile and Expandable jQuery Plotting Plugin
jqPlot is basically a charting plugin and it creates some beautiful pie, line and bar charts. It has a lot of features and offers wide variety of chart styles, offers customizable formatting and a lot more. It has been tested on all famous browsers such IE 7 and onwards, Firefox, safari and Opera.
jQuery Spidergraph Plugin – Dynamic, interactive spidergraphs in HTML5
Looking to create spidergraphs in HTML5? Well, your search ends with jQuery Spidergraph. This is basically a plain and easy to use module and it helps developers in creating goodlooking and attractive spidergraphs. Other features includes, illustrating scaled quantitative data for several subjective attributes and overlaying multiple data.
Producing interactive, zoomable charts is not an easy task. However, dygraphs can definitely help you in doing this. It is basically an open source JavaScript library that proves to be benficial. It is basically designed to display slid data and users can obviously explore the data in order to interpret it.
MAKE PRETTY CHARTS FOR YOUR APP WITH JQUERY AND XCHARTS
I have always believed that charts are a great way to present data in a less complicated way. Creating a professional admin panle won’t be easy without charts. Also, setting them up is a tricky job, isn’t it? However, libraries such as xCharts are making lives a lot easier. You can use it for building some pretty AJAX-powered charts so what are you waiting for? Go ahead, explore it and live a simple, less complicated life.