반응형
반응형

[python] Scatter plot animated using python, ffmpeg


""" 
An animated scatter plot can be created using Python's matplotlib library with its animation module. 
Here's an example of how to create an animated scatter plot, where points move dynamically over time.
"""

import numpy as np
import matplotlib.pyplot as plt
from matplotlib.animation import FuncAnimation

# Generate random initial data for the scatter plot
num_points = 50
x_data = np.random.rand(num_points)
y_data = np.random.rand(num_points)
colors = np.random.rand(num_points)
sizes = np.random.rand(num_points) * 100

# Function to update scatter plot
def update(frame):
    global x_data, y_data
    x_data += (np.random.rand(num_points) - 0.5) * 0.1  # Randomly move x
    y_data += (np.random.rand(num_points) - 0.5) * 0.1  # Randomly move y
    scatter.set_offsets(np.c_[x_data, y_data])  # Update positions
    scatter.set_sizes(np.random.rand(num_points) * 100)  # Update sizes
    scatter.set_array(np.random.rand(num_points))  # Update colors
    return scatter,

# Create the figure and scatter plot
fig, ax = plt.subplots()
scatter = ax.scatter(x_data, y_data, c=colors, s=sizes, cmap='viridis', alpha=0.6)
ax.set_xlim(0, 1)
ax.set_ylim(0, 1)
ax.set_title("Animated Scatter Plot")

# Create animation
ani = FuncAnimation(fig, update, frames=100, interval=50, blit=True)

# Show the animation
plt.show()

import matplotlib.animation as animation
animation.FFMpegWriter = animation.writers['ffmpeg']

""" 
Install FFmpeg: FFmpeg is required to save animations in video formats like .mp4. Install it as follows:

Windows:

Download the FFmpeg executable from https://ffmpeg.org/download.html.
Add the bin folder to your system’s PATH environment variable.

1.EXE  파일 다운받아서  *.7z 파일 다운로드. 

2.압축 풀고,  시스템 환경 변수에 추가. 

3.  ffmpeg -version  으로 실행되는지 확인 

"""

ani.save("animated_scatter.mp4", writer="ffmpeg", fps=30)  # Save as MP4

반응형
반응형


python pair plot 


데이터 세트의 숫자 변수 간의 쌍 관계를 보여주는 산점도 그리드입니다. 일반적으로 데이터 분포와 변수 간의 관계를 이해하는 데 사용됩니다.


import seaborn as sns
import matplotlib.pyplot as plt
import pandas as pd

import sklearn
print(sklearn.__version__)

# Sample dataset (Iris dataset)
from sklearn.datasets import load_iris


iris = load_iris()
df = pd.DataFrame(iris.data, columns=iris.feature_names)
df['species'] = [iris.target_names[i] for i in iris.target]

# Create a pair plot
sns.set(style="ticks")
pairplot = sns.pairplot(df, hue="species", diag_kind="kde")

# Save the pair plot as an image
output_file = "pair_plot.png"
pairplot.savefig(output_file)
print(f"Pair plot saved as {output_file}")

# Show the pair plot
plt.show()


반응형
반응형

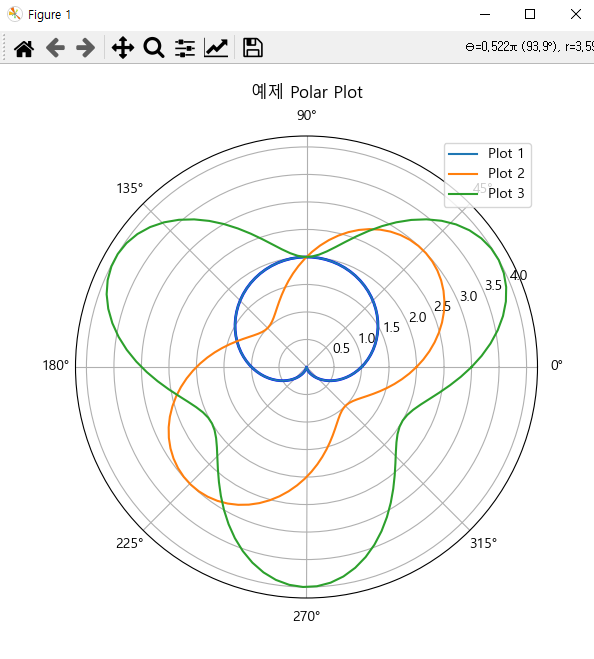
[python] polar plot에서 한글 사용하기. 


Python에서 한글을 matplotlib 플롯에 표시하려면, 폰트를 설정하여 한글이 올바르게 렌더링되도록 해야 합니다. 시스템에 설치된 한글 폰트를 지정하거나, matplotlib에서 기본적으로 한글을 지원하는 폰트를 설정하면 됩니다.

아래는 Example Polar Plot이라는 제목을 한글로 변경하여 출력하는 예제 코드입니다.


import matplotlib.pyplot as plt
import numpy as np

# 한글 폰트 설정 (예: Windows에서는 'Malgun Gothic', MacOS에서는 'AppleGothic')
plt.rcParams['font.family'] = 'Malgun Gothic'  # 또는 'AppleGothic' (Mac)
plt.rcParams['axes.unicode_minus'] = False     # 마이너스 기호 깨짐 방지

# 데이터 준비
angles = np.linspace(0, 2 * np.pi, 100)
radii = 1 + np.sin(angles)

# Polar Plot 생성
plt.figure(figsize=(6, 6))
ax = plt.subplot(111, projection='polar')
ax.plot(angles, radii, color='blue', linewidth=2)

# 한글 제목 추가
ax.set_title("예제 polar plot", va='bottom')
plt.show()

코드 설명

  • plt.rcParams['font.family']: 한글을 표시하기 위한 폰트를 지정합니다. Windows에서는 'Malgun Gothic', MacOS에서는 'AppleGothic'을 사용할 수 있습니다.
  • plt.rcParams['axes.unicode_minus'] = False: 마이너스 기호(-)가 깨지지 않도록 설정합니다.
  • ax.set_title("예제 극좌표 플롯", va='bottom'): 제목을 한글로 설정합니다.

이제 matplotlib 플롯에서 한글 제목이 잘 출력될 것입니다.


반응형
반응형

Python의 matplotlib 라이브러리를 사용하여 polar plot(극좌표 플롯)을 쉽게 그릴 수 있습니다. polar plot은 데이터를 각도와 반경을 사용하여 나타내며, 방위 데이터나 주기적인 패턴을 표현하는 데 유용합니다.

* 코드 설명
    1.theta와 r 설정: theta는 각도 값, r은 반경 값입니다.
         1.1.theta는 0에서 2π까지 균일하게 분포된 100개의 값을 가지며, np.linspace를 사용하여 생성합니다.
         1.2.r은 sin(3 * theta) 함수를 이용하여 생성된 반경 값에 1을 더하여 그래프를 그립니다.

                 이 함수는 각도에 따른 반경의 변화를 표현하며, 주기적인 패턴을 생성합니다.
     2.polar=True 옵션: plt.subplot(111, polar=True)로 설정하여 polar plot을 생성합니다.
     3.그래프 출력: plt.show()로 결과를 화면에 출력합니다.

import matplotlib.pyplot as plt
import numpy as np

# 각도 (theta)와 반경 (r) 값 생성
theta = np.linspace(0, 2 * np.pi, 100)  # 0에서 2π 사이의 각도 값
r = 1 + np.sin(3 * theta)               # 반경 값은 특정 함수로 정의

# Polar plot 생성
plt.figure(figsize=(6, 6))
ax = plt.subplot(111, polar=True)       # polar=True 옵션으로 polar plot 생성
ax.plot(theta, r)

# 플롯 설정
ax.set_title("Polar Plot Example", va='bottom')
plt.show()

import matplotlib.pyplot as plt
import numpy as np

# 임의의 데이터
theta = np.array([0, np.pi/4, np.pi/2, 3*np.pi/4, np.pi])  # 각도 데이터
r = np.array([1, 2, 3, 4, 5])                              # 반경 데이터

# Polar plot 생성
plt.figure(figsize=(6, 6))
ax = plt.subplot(111, polar=True)
ax.plot(theta, r, marker='o')

# 플롯 설정
ax.set_title("Custom Data Polar Plot", va='bottom')
plt.show()

반응형
반응형

matplotlib의 scatter 만들기 . 그래프


Scatter Plots in Python  https://plot.ly/python/line-and-scatter/
reference : https://plot.ly/python/reference/#scatter


plot 버전 체크  


>>import plotly
>>plotly.__version__


scatter 만들기


import plotly.plotly as py

import plotly.graph_objs as go


# Create random data with numpy

import numpy as np


N = 1000

random_x = np.random.randn(N)

random_y = np.random.randn(N)


# Create a trace

trace = go.Scatter(

    x = random_x,

    y = random_y,

    mode = 'markers'

)


data = [trace]


# Plot and embed in ipython notebook!

py.iplot(data, filename='basic-scatter')


# or plot with: plot_url = py.plot(data, filename='basic-line')


...


반응형
반응형

[Python]  python matplotlib 에서 한글폰트 사용하기. font_manager 의 폰트 리스트 확인


아래 구문에서 에러 빵빵나오면 font_manager의 폰트 리스트 확인해서 잘 적용하는 거로! 


from matplotlib import font_manager, rc

#font_fname = '/Library/Fonts/AppleGothic.ttf'     # A font of your choice

#font_fname = 'C:/Windows/Fonts/NanumGothic.ttf'

#font_name = font_manager.FontProperties(fname=font_fname).get_name()

font_name = 'Nanum Gothic Coding'

rc('font', family=font_name)


>>> import matplotlib.font_manager

>>> [f.name for f in matplotlib.font_manager.fontManager.ttflist]

['cmb10', 'cmex10', 'STIXNonUnicode', 'STIXNonUnicode', 'STIXSizeThreeSym', 'STIXSizeTwoSym', 'cmtt10', 'STIXGeneral', 'STIXSizeThreeSym', 'STIXSizeFiveSym', 'STIXSizeOneSym', 'STIXGeneral', 'cmr10', 'STIXSizeTwoSym', ...]

>>> [f.name for f in matplotlib.font_manager.fontManager.afmlist]

['Helvetica', 'ITC Zapf Chancery', 'Palatino', 'Utopia', 'Helvetica', 'Helvetica', 'ITC Bookman', 'Courier', 'Helvetica', 'Times', 'Courier', 'Helvetica', 'Utopia', 'New Century Schoolbook', ...]


.

반응형

+ Recent posts