
반응형
Choosing Colormaps in Matplotlib
https://matplotlib.org/stable/tutorials/colors/colormaps.html
Choosing Colormaps in Matplotlib — Matplotlib 3.5.1 documentation
Colormaps are often split into several categories based on their function (see, e.g., [Moreland]): First, we'll show the range of each colormap. Note that some seem to change more "quickly" than others. Sequential2 Many of the \(L^*\) values from the Seque
matplotlib.org
import numpy as np
import matplotlib as mpl
import matplotlib.pyplot as plt
from matplotlib import cm
from colorspacious import cspace_converter
cmaps = {}
gradient = np.linspace(0, 1, 256)
gradient = np.vstack((gradient, gradient))
def plot_color_gradients(category, cmap_list):
# Create figure and adjust figure height to number of colormaps
nrows = len(cmap_list)
figh = 0.35 + 0.15 + (nrows + (nrows - 1) * 0.1) * 0.22
fig, axs = plt.subplots(nrows=nrows + 1, figsize=(6.4, figh))
fig.subplots_adjust(top=1 - 0.35 / figh, bottom=0.15 / figh,
left=0.2, right=0.99)
axs[0].set_title(f'{category} colormaps', fontsize=14)
for ax, name in zip(axs, cmap_list):
ax.imshow(gradient, aspect='auto', cmap=plt.get_cmap(name))
ax.text(-0.01, 0.5, name, va='center', ha='right', fontsize=10,
transform=ax.transAxes)
# Turn off *all* ticks & spines, not just the ones with colormaps.
for ax in axs:
ax.set_axis_off()
# Save colormap list for later.
cmaps[category] = cmap_list
plot_color_gradients('Perceptually Uniform Sequential',
                     ['viridis', 'plasma', 'inferno', 'magma', 'cividis'])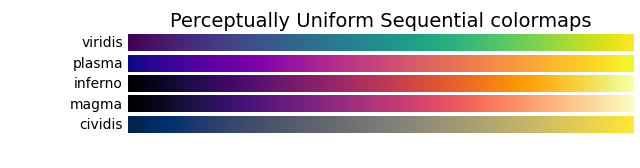
plot_color_gradients('Sequential',
                     ['Greys', 'Purples', 'Blues', 'Greens', 'Oranges', 'Reds',
                      'YlOrBr', 'YlOrRd', 'OrRd', 'PuRd', 'RdPu', 'BuPu',
                      'GnBu', 'PuBu', 'YlGnBu', 'PuBuGn', 'BuGn', 'YlGn'])
반응형
'프로그래밍 > Python' 카테고리의 다른 글
| [python] mpld3 - Bringing Matplotlib to the Browser (0) | 2022.02.23 |
|---|---|
| [python] networkx - Graph Layout (0) | 2022.02.16 |
| [python] Apyori - 연관규칙분석(Association Rule Analysys) (0) | 2022.02.16 |
| [python] networkx - anaconda install (0) | 2022.02.16 |
| [python] Mlxtend (machine learning extensions) install (0) | 2022.02.15 |