반응형

https://gojs.net/latest/index.html


GoJS - Build Interactive Diagrams for the Web

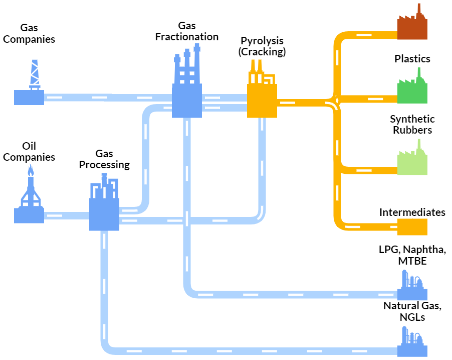
GoJS A Web Framework for Rapidly Building Interactive Diagrams

gojs.net

GoJS in 12 Minutes: JavaScript Diagramming Library Tutorial


https://www.youtube.com/watch?v=7cfHF7yAoJE 


GoJS Samples  https://gojs.net/latest/samples/


GoJS Sample Diagrams for JavaScript and HTML, by Northwoods Software


gojs.net

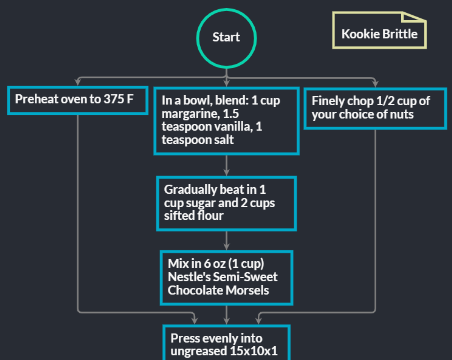
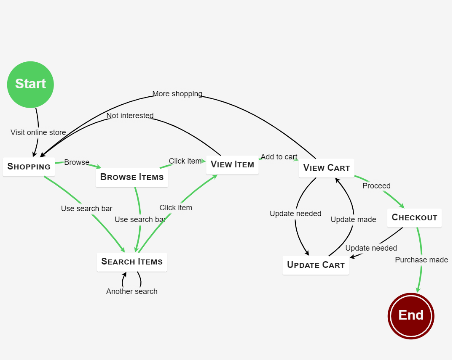
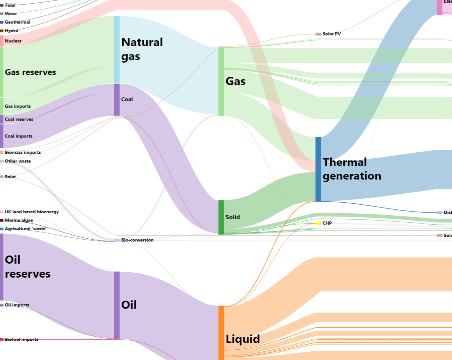
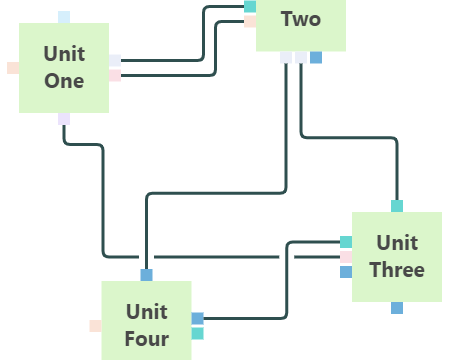
Our samples demonstrate how to build several Diagram types and showcase specific features and layouts. You can use the HTML and JavaScript in these samples as the starting point for your application.

If you are done looking around and are ready to experiment with GoJS, read the getting started tutorial.

There is a React sample on GitHub at: gojs-react-basic, and an Angular sample at: gojs-angular-basic. See more at Projects.

If you are looking for examples of a particular GoJS method or property, you can search the source code of all samples and extensions and documentation on GitHub:


반응형
반응형

 GoJS - Interactive JavaScript Diagrams for the Web

GoJS is a JavaScript and TypeScript library for building interactive diagrams and graphs

From simple flowcharts and org charts to highly-specific industrial diagrams, SCADA and BPMN diagrams, medical diagrams such as genograms and outbreak modeling diagrams, and more. GoJS makes constructing graphs of complex nodes, links, and groups easy with customizable templates and layouts.

GoJS offers advanced features for user interactivity such as drag-and-drop, copy-and-paste, in-place text editing, tooltips, context menus, automatic layouts, templates, data binding and models, transactional state and undo management, palettes, overviews, event handlers, commands, extensible tools for custom operations, and customizable animations.

We maintain hundreds of sample diagrams, detailing different examples of interactivity, templates, and user logic for you to start from. We offer free developer-to-developer support during evaluation.

Flowcharts

Build interactive flowcharts or flow diagrams. Let your users build, modify, and save Diagrams with JSON model output.

State Charts

Visualize State Charts and other behavior diagrams. Create diagrams with live updates to monitor state, or interactive diagrams for planning.

Sankey Diagrams

GoJS allows considerable customization of Links and Nodes to build all kinds of diagrams. Visualize flow, or connect pipes

Genogram Diagrams

Create Genogram and Medical diagrams, or editable family trees with collapsible levels.

Org Charts

Create classic org charts for viewing or editing. Automatic layouts make different visualization options easy.

Dynamic Ports

Dynamically add ports and custom link routing. Use data-bindings to save and load routes within the Model JSON.

Industrial Processes

Model industrial processes, workflows, SCADA diagrams and more. Permissions and validation make it easy to add rules and constraints when your customers build diagrams.

Dynamic Grouping

Use groups as containers and subgraphs, with group members bounds by their own rules and layouts.

반응형

+ Recent posts