Best jQuery Chart Libraries for Building Interactive Charts
http://codegeekz.com/best-jquery-chart-libraries-for-building-interactive-charts/
1. Chart.js : Charting Library with HTML5 Canvas
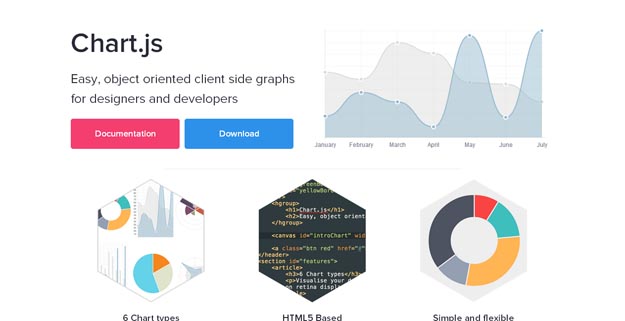
Chart.js is an impressive JavaScript charting library that is built on top of HTML5 canvas. It currently supports 6 chart types (line, bar, radar, pie, column and polar area) and all this comes in a standalone, less than 5kb package. Colors, fonts, borders and their sizes can all be customized. Also, optionally, charts can be loaded with an animation.
Source
2. xCharts : For Building Data-Driven Charts
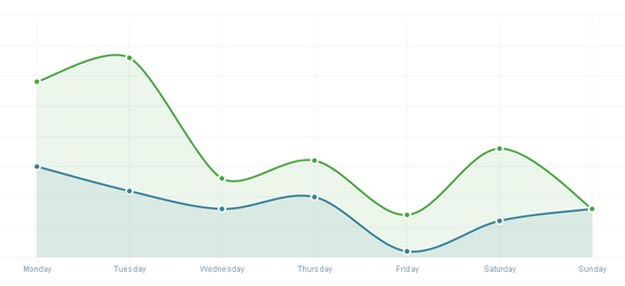
xCharts is a JavaScript library for building beautiful and custom data-driven chart visualizations for the web using D3.js. Using HTML, CSS, and SVG, xCharts are designed to be dynamic, fluid, and open to integrations and customization.
Since xCharts use SVG, we are able to accomplish most of our styling of xCharts directly through CSS. This means you have quite a bit of control to handle the visualization however you want. The best way to style charts is to start with the included stylesheet, or use your browser’s element inspector to see each elements CSS class selectors that are available to use.
Source
3. Sigma.js : Draw Graphs Using HTML5 Canvas Element
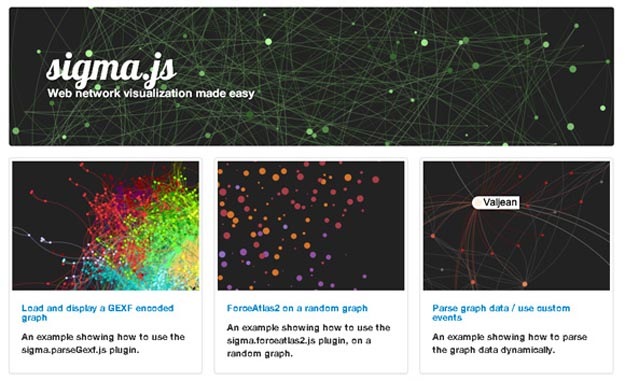
Sigma.js is a free and open-source JavaScript library to draw graphs, using the HTML5 canvas element. It has been especially designed to share interactive network maps on a Web page or to explore dynamically a network database. It is distributed under the MIT License.
Source
4. HighCharts
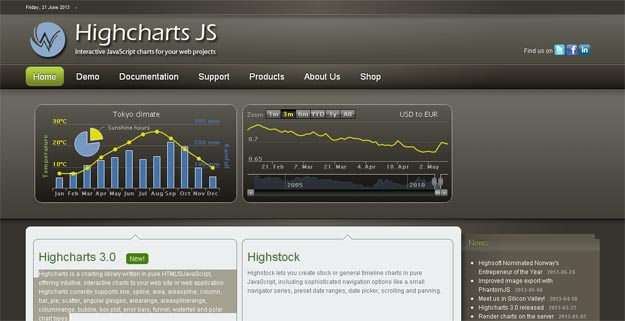
Highcharts is a charting library written in pure HTML5/JavaScript, offering intuitive, interactive charts to your web site or web application. Highcharts currently supports line, spline, area, areaspline, column, bar, pie, scatter, angular gauges, arearange, areasplinerange, columnrange, bubble, box plot, error bars, funnel, waterfall and polar chart types.
Source
5. Fusion Charts
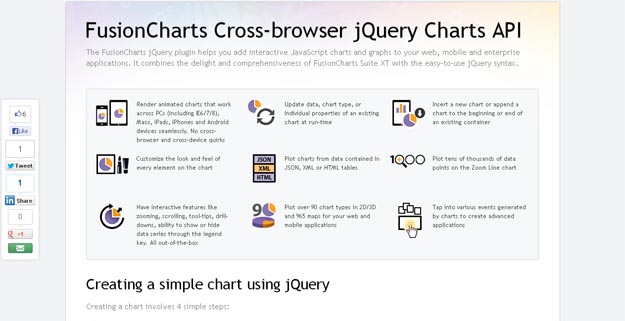
The FusionCharts jQuery plugin helps you add interactive JavaScript charts and graphs to your web, mobile and enterprise applications. It combines the delight and comprehensiveness of FusionCharts Suite XT with the easy-to-use jQuery syntax.
Source
6. Flot : Attractive JavaScript Plotting for jQuery
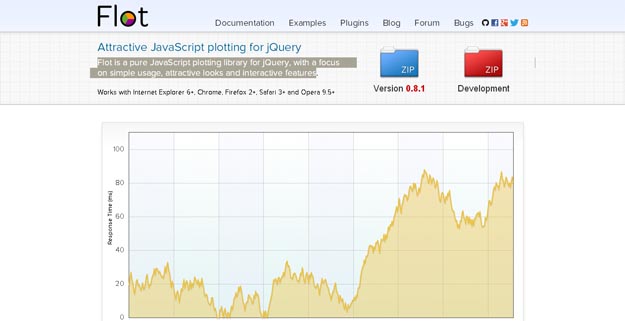
Flot is a pure JavaScript plotting library for jQuery, with a focus on simple usage, attractive looks and interactive features. Some key features of plot is turning series on/off, zooming, interacting with the data points and it integrates a simple tooltip feature.
Source
7. JS Charts : Free JavaScript Charts
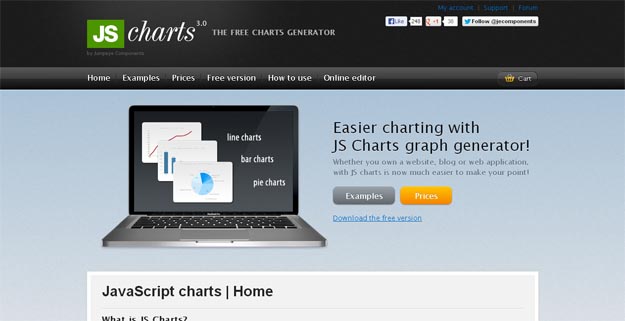
JS Charts is a JavaScript based chart generator that requires little or no coding. With JS Charts drawing charts is a simple and easy task, since you only have to use client-side scripting (i.e. performed by your web browser). No additional plugins or server modules are required. Just include our scripts, prepare your chart data in XML, JSON or JavaScript Array and your chart is ready!
Source
8. jQuery Sparklines
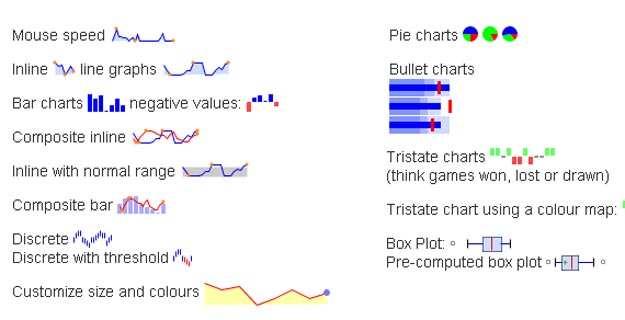
This jQuery plugin generates sparklines (small inline charts) directly in the browser using data supplied either inline in the HTML, or via javascript. The plugin is compatible with most modern browsers and has been tested with Firefox 2+, Safari 3+, Opera 9, Google Chrome and Internet Explorer 6, 7, 8 & 9 as well as iOS and Android.
Source
9. Morris.js : Draw Time-Series Line Graphs
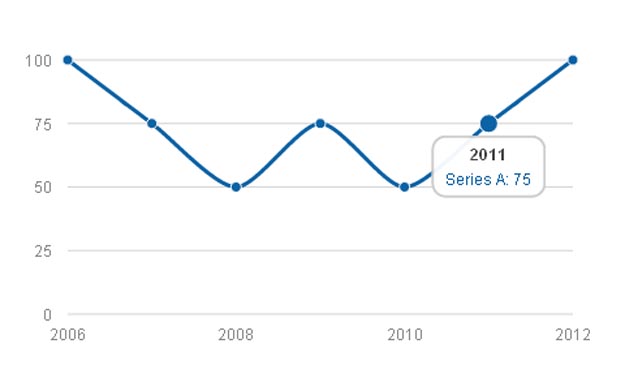
Morris.js is a lightweight library that uses jQuery and Raphaël to make drawing time-series graphs easy. Morris.js started life as the code that powered the graphs on howmanyleft.co.uk. Now it’s been open-sourced for the whole world to extend and enjoy.
Source
10. jQuery OrgChart
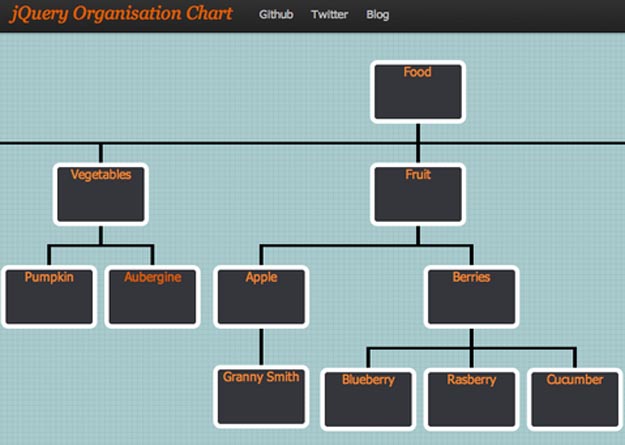
jQuery OrgChart is a plugin that allows you to render structures with nested elements in a easy-to-read tree structure. To build the tree all you need is to make a single line call to the plugin and supply the HTML element Id for a nested unordered list element that is representative of the data you’d like to display.
Source
11. jgPlot
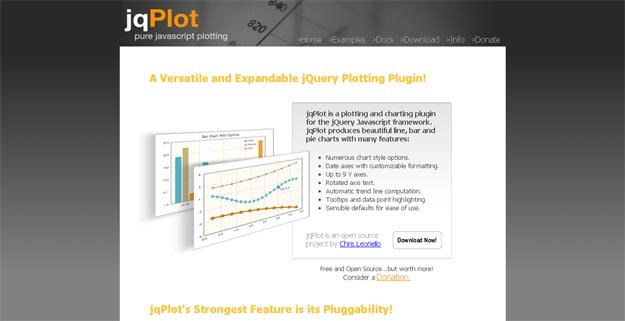
jqPlot is a plotting and charting plugin for the jQuery Javascript framework. jqPlot produces beautiful line, bar and pie charts with many features like rotated axis text, automatic trend line computation, tooltips and data point highlighting, sensible defaults for ease of use and many more.
Source
12. Grafico
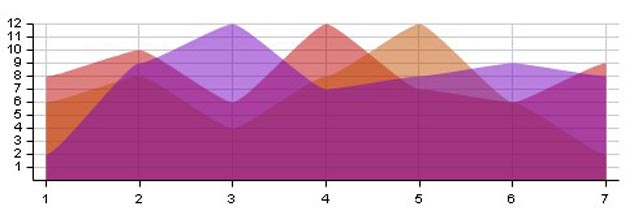
Grafico is a javascript charting library built with Raphaël and Prototype.js. The library provides a wide array of graphs and stays with the guidelines laid out by Stephen Few and Edward Tufte. Grafico provides pretty charts that effectively communicate their information.
Source
13. GraphUp
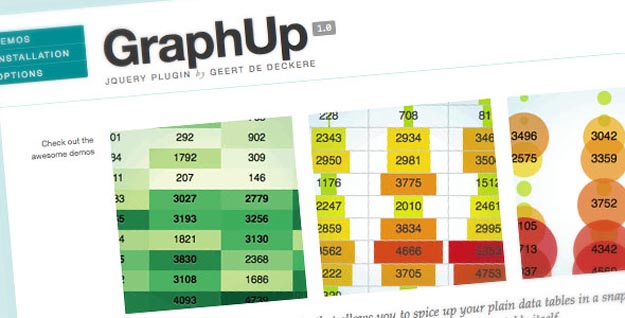
GraphUp is a very flexible and lightweight jQuery (v1.4+) plugin to spice up your data tables. It visualizes the values using color, bar charts and bubbles.
Source
14. dygraphs
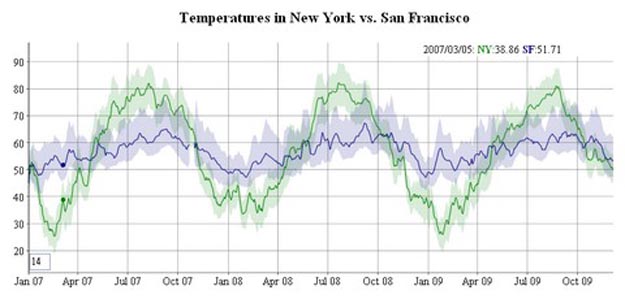
dygraphs is an open source JavaScript library that produces produces interactive, zoomable charts of time series. It is designed to display dense data sets and enable users to explore and interpret them. You can mouse over to highlight individual values. Click and drag to zoom. Double-click to zoom back out. Change the number and hit enter to adjust the averaging period.
Source
15. jsPlumb jQuery Plugin
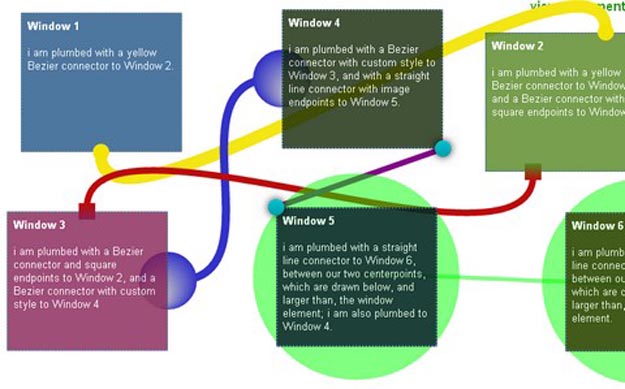
jsPlumb jQuery plugin provides a means for a developer to visually connect elements on their web page, in much the same way you might have seen on Yahoo Pipes. jsPlumb allows you to connect elements on the screen with “plumbing”, using a Canvas element when supported, and Google’s Explorer Canvas script to support older browsers. Full transparent support for jQuery dragging is included, the API is super simple, and the compressed version of the script is just 10.5K.
Source
 Best jQuery Chart Libraries for Building Interactive Charts Code Geekz.mht


