반응형
반응형
""" 
정렬 알고리즘 실행 시 비용 계산은 보통 실행 시간(시간 복잡도)이나 작업 횟수를 측정하여 이뤄집니다. 

이를 위해 Python에서 time 모듈이나 timeit 모듈을 사용할 수 있습니다. 

시간 복잡도에 따른 차이

1.퀵 정렬:
    평균 시간 복잡도 𝑂(𝑛log⁡𝑛)O(nlogn).
    큰 데이터셋에서도 효율적으로 작동.

2.버블 정렬:
    최악 및 평균 시간 복잡도 𝑂(𝑛2)O(n 2 ).
    작은 데이터셋에서는 괜찮지만, 데이터 크기가 클수록 비효율적.
    
"""
import time  # 실행 시간 측정을 위한 모듈

# 퀵 정렬 알고리즘
def quick_sort(arr):
    if len(arr) <= 1:
        return arr
    pivot = arr[len(arr) // 2]
    left = [x for x in arr if x < pivot]
    middle = [x for x in arr if x == pivot]
    right = [x for x in arr if x > pivot]
    return quick_sort(left) + middle + quick_sort(right)

# 버블 정렬 알고리즘
def bubble_sort(arr):
    n = len(arr)
    for i in range(n):
        for j in range(0, n - i - 1):
            if arr[j] > arr[j + 1]:
                arr[j], arr[j + 1] = arr[j + 1], arr[j]
    return arr

# 테스트 데이터 생성
import random
array_size = 1000  # 데이터 크기
test_array = random.sample(range(1, 10000), array_size)


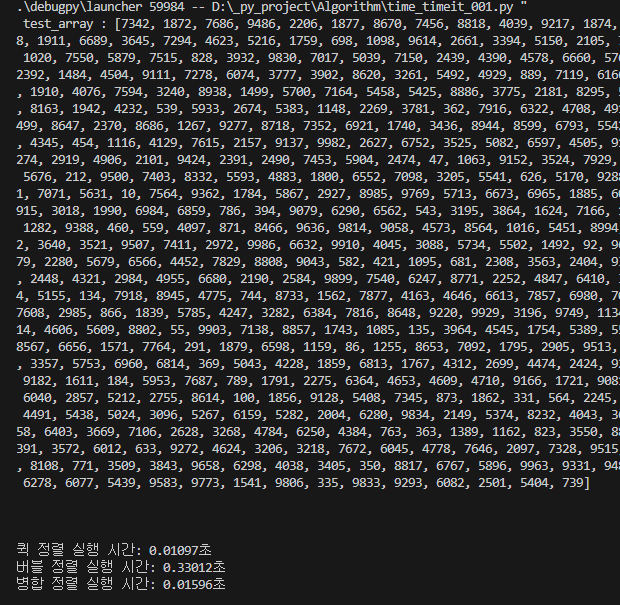
print(f" test_array : {test_array} \n\n\n")

# 퀵 정렬 실행 시간 측정
start_time = time.time()
quick_sort(test_array.copy())
end_time = time.time()
print(f"퀵 정렬 실행 시간: {end_time - start_time:.5f}초")

# 버블 정렬 실행 시간 측정
start_time = time.time()
bubble_sort(test_array.copy())
end_time = time.time()
print(f"버블 정렬 실행 시간: {end_time - start_time:.5f}초")


# 병합 정렬 알고리즘
def merge_sort(arr):
    if len(arr) <= 1:
        return arr
    mid = len(arr) // 2
    left = merge_sort(arr[:mid])
    right = merge_sort(arr[mid:])
    return merge(left, right)

def merge(left, right):
    result = []
    i = j = 0
    while i < len(left) and j < len(right):
        if left[i] < right[j]:
            result.append(left[i])
            i += 1
        else:
            result.append(right[j])
            j += 1
    result.extend(left[i:])
    result.extend(right[j:])
    return result

# 병합 정렬 실행 시간 측정
start_time = time.time()
merge_sort(test_array.copy())
end_time = time.time()
print(f"병합 정렬 실행 시간: {end_time - start_time:.5f}초")

[python] 정렬 알고리즘 실행 시 비용 계산은 보통 실행 시간(시간 복잡도)이나 작업 횟수를 측정


반응형
반응형

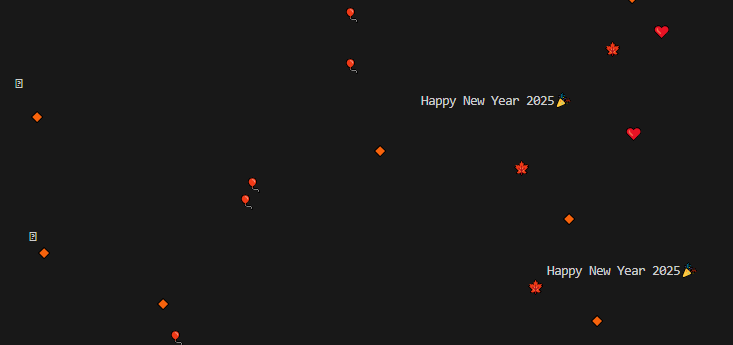
[python] Happy New year 2025 loop

import time
from random import randint


for i in range(1,85):
    print('')

space = ''


for i in range(1,1000):
    count = randint(1, 100)
    while(count > 0):
        space += ' '
        count -= 1

    if(i%10==0):
        print(space + 'Happy New Year 2025🎉')
    elif(i%9 == 0):
        print(space + "🪅")
    elif(i%5==0):
        print(space +"🎈")
    elif(i%8==0):
        print(space + "🎈")
    elif(i%7==0):
        print(space + "🍁")
    elif(i%6==0):
        print(space + "❤️")
    else:
        print(space + "🔸")

    space = ''
    time.sleep(0.2)
 
반응형
반응형

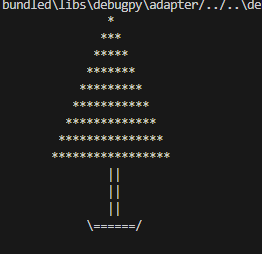
[python] Merry christmas Tree

import numpy as np
x = np.arange(7,16);
y = np.arange(1,18,2);
z = np.column_stack((x[:: -1],y))
for i,j in z:
    print(' '*i+'*'*j)
for r in range(3):
    print(' '*13, ' || ')
print(' '*12, end = '\======/')    
print('')

               *
              ***
             *****
            *******
           *********
          ***********
         *************
        ***************
       *****************
               ||
               ||
               ||
         \======/


반응형
반응형


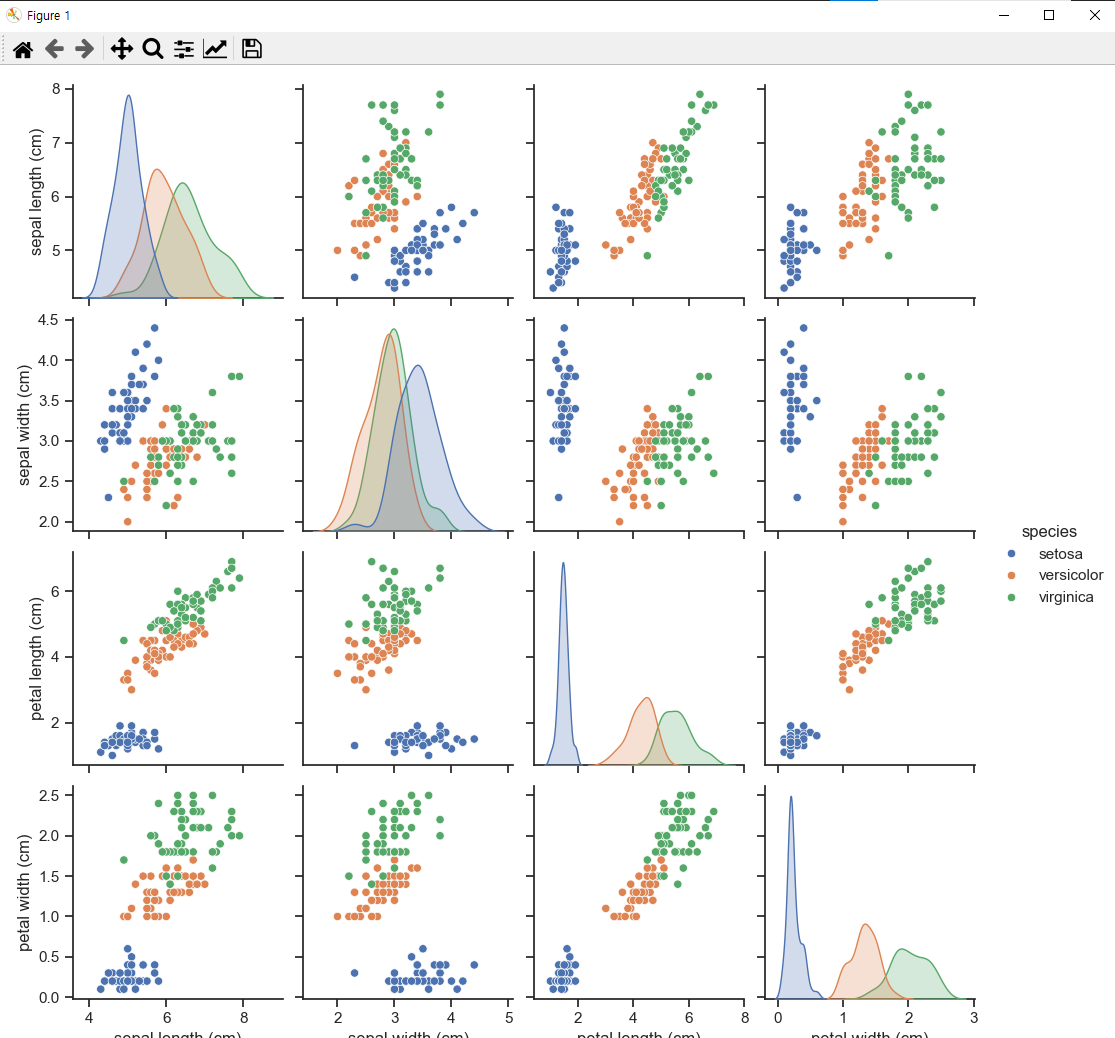
python pair plot 


데이터 세트의 숫자 변수 간의 쌍 관계를 보여주는 산점도 그리드입니다. 일반적으로 데이터 분포와 변수 간의 관계를 이해하는 데 사용됩니다.


import seaborn as sns
import matplotlib.pyplot as plt
import pandas as pd

import sklearn
print(sklearn.__version__)

# Sample dataset (Iris dataset)
from sklearn.datasets import load_iris


iris = load_iris()
df = pd.DataFrame(iris.data, columns=iris.feature_names)
df['species'] = [iris.target_names[i] for i in iris.target]

# Create a pair plot
sns.set(style="ticks")
pairplot = sns.pairplot(df, hue="species", diag_kind="kde")

# Save the pair plot as an image
output_file = "pair_plot.png"
pairplot.savefig(output_file)
print(f"Pair plot saved as {output_file}")

# Show the pair plot
plt.show()


반응형
반응형

[python] Generate OTP using python


Here’s how you can generate a one-time password (OTP) using Python:

import random

def generate_otp(length=6):
    """
    Generates a numeric OTP of the given length.
    Default length is 6.
    """
    if length <= 0:
        raise ValueError("Length must be greater than zero")
    otp = ''.join([str(random.randint(0, 9)) for _ in range(length)])
    return otp

# Example usage
otp = generate_otp(6)
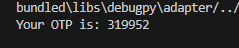
print(f"Your OTP is: {otp}")


Your OTP is: 583920

반응형
반응형

https://pypi.org/project/rich/


rich

Render rich text, tables, progress bars, syntax highlighting, markdown and more to the terminal

pypi.org

Rich is a Python library for rich text and beautiful formatting in the terminal.

The Rich API makes it easy to add color and style to terminal output. Rich can also render pretty tables, progress bars, markdown, syntax highlighted source code, tracebacks, and more — out of the box.

python -m pip install rich


from rich.progress import Progress
import time

def main():
    with Progress() as progress:
        task1 = progress.add_task("[cyan]Downloading...", total=100)
        task2 = progress.add_task("[magenta]Processing...", total=200)

        while not progress.finished:
            time.sleep(0.03)  # Simulate some work
            progress.update(task1, advance=1)
            progress.update(task2, advance=0.5)

if __name__ == "__main__":
    main()


from rich.progress import Progress
import time

def main():
    # Create a progress bar
    with Progress() as progress:
        # Add a task
        task = progress.add_task("[cyan]Processing...", total=100)
        
        # Update progress
        for i in range(100):
            time.sleep(0.05)  # Simulate some work
            progress.update(task, advance=1)  # Advance the progress bar by 1

if __name__ == "__main__":
    main()
반응형

+ Recent posts