반응형
반응형

matplotlib의 scatter 만들기 . 그래프


Scatter Plots in Python  https://plot.ly/python/line-and-scatter/
reference : https://plot.ly/python/reference/#scatter


plot 버전 체크  


>>import plotly
>>plotly.__version__


scatter 만들기


import plotly.plotly as py

import plotly.graph_objs as go


# Create random data with numpy

import numpy as np


N = 1000

random_x = np.random.randn(N)

random_y = np.random.randn(N)


# Create a trace

trace = go.Scatter(

    x = random_x,

    y = random_y,

    mode = 'markers'

)


data = [trace]


# Plot and embed in ipython notebook!

py.iplot(data, filename='basic-scatter')


# or plot with: plot_url = py.plot(data, filename='basic-line')


...


반응형
반응형

[python] konlpy 하다가 그래프에 한글 안나올때, 어제는 안되고 오늘은 되네.


https://www.lucypark.kr/courses/2015-dm/text-mining.html


맥북에서 그래프에 한글 계속 안나오다가, 오늘 해보니까 또 나오네. 뭔 조화인가? 오타인가? 


Troubleshooting: For those who see rectangles instead of letters in the saved plot file, include the following configurations before drawing the plot:

from matplotlib import font_manager, rc
font_fname = 'c:/windows/fonts/gulim.ttc'     # A font of your choice
font_name = font_manager.FontProperties(fname=font_fname).get_name()
rc('font', family=font_name)

Some example fonts:

  • Mac OS: /Library/Fonts/AppleGothic.ttf


.

반응형
반응형

[Python] 그래프에서 한글 깨질때


bar 차트를 그리기 위해서 먼저 필요한 모듈을 import합니다. matplotlib.pyplot과 numpy 모듈은 기존에도 자주 사용했지만 font_manager와 rc 모듈은 처음으로 import하는 모듈입니다. 해당 모듈은 그래프를 그릴 때 한글 폰트를 설정하기 위해 사용합니다.

import matplotlib.pyplot as plt
import numpy as np
from matplotlib import font_manager, rc

그림 15.23을 참조하면 업종명이 한글로 출력됨을 확인할 수 있습니다. matplotlib는 한글 폰트를 설정해주지 않으면 기본적으로 한글이 제대로 출력되지 않습니다. 따라서 데이터에 한글이 포함되어 있다면 다음과 같이 사용할 한글 폰트를 설정해줘야 한글이 정상적으로 출력됩니다.

font_name = font_manager.FontProperties(fname="c:/Windows/Fonts/malgun.ttf").get_name()
rc('font', family=font_name)

폰트를 설정하기 위해서는 폰트 이름을 알아야 합니다. 윈도우 7부터는 '맑은 고딕'이라는 폰트가 기본 폰트로 사용되고 있기 때문에, 본 예제에서는 'c:/Windows/Fonts/malgun.ttf'라는 경로를 사용했습니다. 폰트의 설치 경로로부터 폰트 이름을 먼저 알아낸 후 rc 함수를 통해서 폰트를 설정했습니다.


.

반응형
반응형

JavaScript InfoVis Toolkit


http://philogb.github.io/jit/index.html


Demo : http://philogb.github.io/jit/demos.html


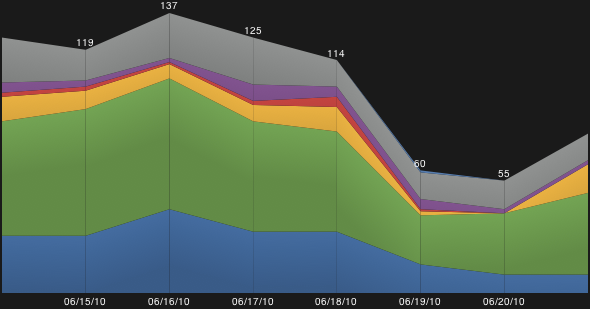
The JavaScript InfoVis Toolkit provides tools for creating Interactive Data Visualizations for the Web.


자바스트립트 그래프, 정보표시


.

반응형
반응형

Circliful: Circular loaders with jQuery


Circliful is a jQuery plugin that makes it easy to add circular loaders to your webpages. Configurable options allow you to loading text and info text, and you can even use half-circles.

circliful


반응형

+ Recent posts