반응형
반응형

Pandas df.to_csv("file.csv" encode="utf-8") still gives trash characters for minus sign


Pandas df.to_csv("file.csv" encode="utf-8") still gives trash characters for minus sign

I've read something about a Python 2 limitation with respect to Pandas' to_csv( ... etc ...). Have I hit it? I'm on Python 2.7.3 This turns out trash characters for ≥ and - when they appear in st...

stackoverflow.com

https://stackoverflow.com/questions/25788037/pandas-df-to-csvfile-csv-encode-utf-8-still-gives-trash-characters-for-min
pandas dataframe을 csv 형태로,  to_csv 


utf-8 encoding으로 저장하면 
내용 중 한글이 깨지는 문제 발생
euc-kr 로 저장할 때는 문제 없음
df.to_csv('file.csv',encoding='euc-kr')


df.to_csv('file.csv',encoding='utf-8')
한글 깨짐


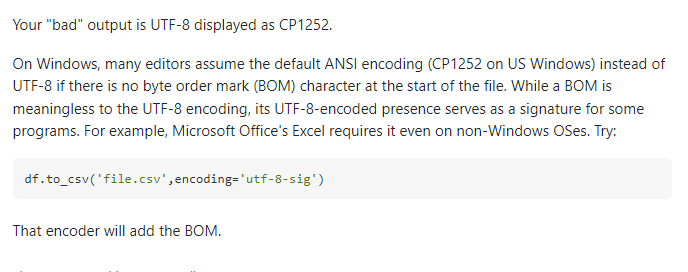
해결책: df.to_csv('file.csv',encoding='utf-8-sig')


windows 환경 (정확히는 win7)
Python 3.6.4 :: Anaconda custom (64-bit)
pandas==0.23.4


반응형
반응형


pip install pandas 


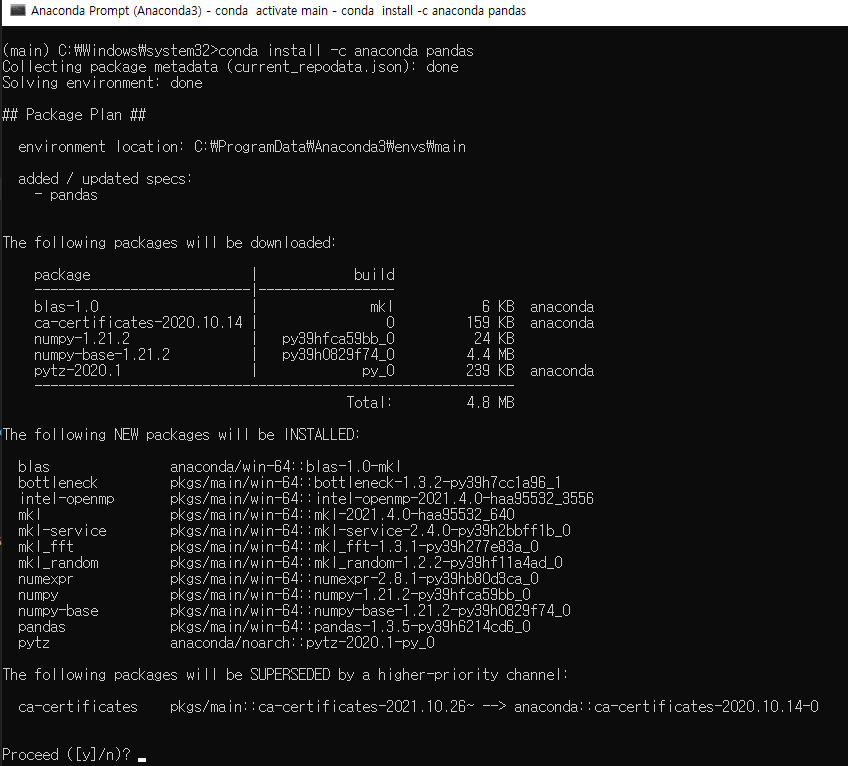
conda install -c anaconda pandas 

When working with tabular data, such as data stored in spreadsheets or databases, pandas is the right tool for you. pandas will help you to explore, clean, and process your data. In pandas, a data table is called a DataFrame.

반응형
반응형


Danfo.js는 구조화 된 데이터를 조작하고 처리하기위한 직관적이고 사용하기 쉬운 고성능 데이터 구조를 제공하는 오픈 소스 JavaScript 라이브러리입니다.

Danfo.js is an open-source, JavaScript library providing high-performance, intuitive, and easy-to-use data structures for manipulating and processing structured data.

https://danfo.jsdata.org/

Danfo.js Documentation

Danfo.js is an open-source, JavaScript library providing high-performance, intuitive, and easy-to-use data structures for manipulating and processing structured data.

danfo.jsdata.org

https://blog.tensorflow.org/2020/08/introducing-danfo-js-pandas-like-library-in-javascript.html?hl=ko&m=1

Introducing Danfo.js, a Pandas-like Library in JavaScript

Danfo.js is an open-source, JavaScript library that provides high-performance, intuitive, and easy-to-use data structures for manipulating and processing structured data. Danfo.js is heavily inspired by the Python Pandas library and provides a similar inte

blog.tensorflow.org

반응형
반응형

맷플롯립(Matplotlib)은 데이터를 차트(chart)나 플롯(plot)으로 시각화(visulaization)하는 패키지입니다. 데이터 분석에서 Matplotlib은 데이터 분석 이전에 데이터 이해를 위한 시각화나, 데이터 분석 후에 결과를 시각화하기 위해서 사용됩니다.

아나콘다를 설치하지 않았다면 아래의 커맨드로 Matplotlib를 별도 설치할 수 있습니다.

pip install matplotlib
> ipython
...
In [1]: import matplotlib as mpl
In [2]: mpl.__version__
Out[2]: '2.2.3'

Matplotlib을 다 설치하였다면 Matplotlib의 주요 모듈인 pyplot을 임포트할 수 있습니다. 해당 모듈을 임포트할 때는 주로 plt라는 이름으로 사용합니다. 또한 주피터 노트북으로 matplotlib을 실습하기 위해서는 주피터 노트북에 그림을 표시하도록 지정하는 %matplotlib inline 또한 우선 수행해야 합니다. 아래의 모든 실습들은 아래 내용을 임포트하였다고 가정합니다.

pyplot의 경우, 주로 plt라는 명칭으로 임포트하는 것이 관례입니다.

%matplotlib inline
import matplotlib.pyplot as plt

라인 플롯 그리기

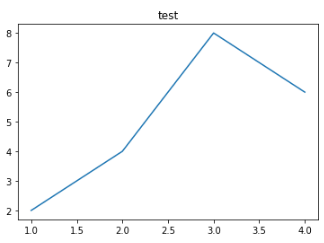
plot()은 라인 플롯을 그리는 기능을 수행합니다. plot() X축과 Y축의 값을 기재하고 그림을 표시하는 show()를 통해서 시각화해봅시다. 그래프에는 제목을 지정해줄 수 있는데 이 경우에는 title('원하는 제목')을 사용합니다. 여기서는 그래프에 'test'라는 제목을 넣어봅시다.

사실 주피터 노트북에서는 show()를 사용하지 않더라도 그래프가 자동으로 렌더링 되므로 그래프가 시각화가 되는 것을 확인할 수 있지만, 여기서는 다른 개발 환경에서 사용할 때 또한 가정하여 show()를 실습 코드에 삽입하였습니다.

plt.title('students')
plt.plot([1,2,3,4],[2,4,8,6])
plt.plot([1.5,2.5,3.5,4.5],[3,5,8,10]) #라인 새로 추가
plt.xlabel('hours')
plt.ylabel('score')
plt.legend(['A student', 'B student']) #범례 삽입
plt.show()


반응형
반응형


 외부 데이터 읽기

Pandas는 CSV, 텍스트, Excel, SQL, HTML, JSON 등 다양한 데이터 파일을 읽고 데이터 프레임을 생성할 수 있습니다.

예를 들어 csv 파일을 읽을 때는 pandas.read_csv()를 통해 읽을 수 있습니다.
다음과 같은 example.csv 파일이 있다고 합시다.


df=pd.read_csv('example.csv 파일의 경로') # example.csv 파일 읽기
# 예를 들어 윈도우 바탕화면에서 작업한 저자의 경우
# df=pd.read_csv(r'C:\Users\USER\Desktop\example.csv')였습니다.
print(df)

이 경우 인덱스가 자동으로 부여된 것을 볼 수 있습니다. 인덱스를 출력해보도록 하겠습니다.

> print(df.index)
RangeIndex(start=0, stop=6, step=1)
반응형
반응형

데이터 분석을 위한 필수 패키지 삼대장이 있습니다. 바로 Pandas와 Numpy 그리고 Matplotlib입니다. 


CMD는 "관리자 권한으로 실행" 하시오. 


판다스(Pandas)는 파이썬 데이터 처리를 위한 라이브러리입니다. 파이썬을 이용한 데이터 분석과 같은 작업에서 필수 라이브러리로 알려져있습니다. 참고 할 수 있는 Pandas 링크는 다음과 같습니다.

링크 : http://pandas.pydata.org/pandas-docs/stable/

아나콘다를 설치하지 않았다면 아래의 커맨드로 Pandas를 별도 설치할 수 있습니다.

pip install pandas
pip uninstall pandas

>import pandas as pd
>pd.__version__


Pandas는 총 세 가지의 데이터 구조를 사용합니다.
1. 시리즈(Series)
2. 데이터프레임(DataFrame)
3. 패널(Panel)


1. 시리즈(Series)

sr = pd.Series([17000, 18000, 1000, 5000],
       index=["피자", "치킨", "콜라", "맥주"])
print(sr)
피자    17000
치킨    18000
콜라     1000
맥주     5000
dtype: int64
print(sr.values)
[17000 18000  1000  5000]
print(sr.index)
Index(['피자', '치킨', '콜라', '맥주'], dtype='object')

2) 데이터프레임(DataFrame)

데이터프레임은 2차원 리스트를 매개변수로 전달합니다. 2차원이므로 행방향 인덱스(index)와 열방향 인덱스(column)가 존재합니다. 즉, 행과 열을 가지는 자료구조입니다. 시리즈가 인덱스(index)와 값(values)으로 구성된다면, 데이터프레임은 열(columns)까지 추가되어 열(columns), 인덱스(index), 값(values)으로 구성됩니다.

values = [[1, 2, 3], [4, 5, 6], [7, 8, 9]]
index = ['one', 'two', 'three']
columns = ['A', 'B', 'C']

df = pd.DataFrame(values, index=index, columns=columns)
print(df)
       A  B  C
one    1  2  3
two    4  5  6
three  7  8  9
print(df.index) # 인덱스 출력
Index(['one', 'two', 'three'], dtype='object')
print(df.columns) # 열 출력
Index(['A', 'B', 'C'], dtype='object')
print(df.values) # 값 출력
[[1 2 3]
 [4 5 6]
 [7 8 9]]


넘파이(Numpy)는 수치 데이터를 다루는 파이썬 패키지입니다. Numpy의 핵심이라고 불리는 다차원 행렬 자료구조인 ndarray를 통해 벡터 및 행렬을 사용하는 선형 대수 계산에서 주로 사용됩니다. Numpy는 편의성뿐만 아니라, 속도면에서도 순수 파이썬에 비해 압도적으로 빠르다는 장점이 있습니다.

pip install numpy
> ipython
...
In [1]: import numpy as np
In [2]: np.__version__
Out[2]: '1.16.5'

Numpy의 주요 모듈은 아래와 같습니다.
1. np.array() # 리스트, 튜플, 배열로 부터 ndarray를 생성
2. np.asarray() # 기존의 array로 부터 ndarray를 생성
3. np.arange() # range와 비슷
4. np.linspace(start, end, num) # [start, end] 균일한 간격으로 num개 생성
5. np.logspace(start, end, num) # [start, end] log scale 간격으로 num개 생성


맷플롯립(Matplotlib)은 데이터를 차트(chart)나 플롯(plot)으로 시각화(visulaization)하는 패키지입니다. 데이터 분석에서 Matplotlib은 데이터 분석 이전에 데이터 이해를 위한 시각화나, 데이터 분석 후에 결과를 시각화하기 위해서 사용됩니다.

%matplotlib inline
import matplotlib.pyplot as plt

plt.title('test')
plt.plot([1,2,3,4],[2,4,8,6])
plt.show()


wikidocs.net/32829


위키독스

온라인 책을 제작 공유하는 플랫폼 서비스

wikidocs.net


반응형

+ Recent posts