Plotly를 사용한 게이지 차트 (Gauge Chart) 생성 예제 (Python Code)
Plotly Tutorial - 파이썬 시각화의 끝판왕 마스터하기 https://wikidocs.net/book/8909
https://plotly.com/python-api-reference/plotly.graph_objects.html
plotly.graph_objects: low-level interface to figures, traces and layout — 6.3.0 documentation
plotly.graph_objects: low-level interface to figures, traces and layout plotly.graph_objects contains the building blocks of plotly Figure: traces (Scatter, Bar, …) and Layout >>> import plotly.graph_objects as go Figure Figure([data, layout, frames,
plotly.com
Plotly는 인터렉티브한 시각화가 가능한 파이썬 그래픽 라이브러리 입니다. 기본적인 시각화부터 통계, 재무, 지리 과학 및 3-dimensional 을 포함한 40개 이상의 차트 타입을 제공하는 오픈소스 입니다. 기본적으로 쥬피터 노트북에 시각화가 가능하며 인터렉티브한 dashboards 위해 Dash 또는 Chart Studio와 같은 라이브러리와 통합 및 확장이 가능합니다.
특징
- Interactive 한 시각화 가능하여 사용자가 시각화된 그래프를 쉽게 줌인, 줌아웃 및 툴팁을 활용한 데이터확인이 가능합니다. (Matplotlib/Seaborn 과의 가장 큰 차이점)
- Dash, 및 chart Studio 와같은 visualisation tools 연동으로 Web 및 application 통해 확인이 가능합니다.
- matplotlib 대비 코드가 훨씬 간편합니다.(이 책을 통해 익숙해진다면..)
- Python 뿐만 아니라 R, Julia, MATLAB 등과 같은 다른 프로그래밍 언어를 스크립트를 사용하여 이용이 가능합니다.
- Plotly는 기본적으로 JSON(JavaScript Object Notation) 형태를 주고받는 구조로 되어있습니다. 하지만 걱정 하실필요 없습니다. 본 책에서는 복잡한 JSON 형태가 아닌 직관적인 객체를 사용하는 방법으로 진행할 예정입니다.
- Matplotlib 차트를 Plotly 차트로 변화나는 기능이 지원됩니다.
- Pandas와의 호환 기능이 추가되어 판다스 plotting 백엔드에 Plotly를 설정하면 Padas 데이터프레임에서 바로 Plotly 로 시각화가 가능합니다.
- 기본적인 색감이 매우 이쁩니다.(개인적인 취향)
- 라이센스가 무료 입니다.

"""
    pip install plotly
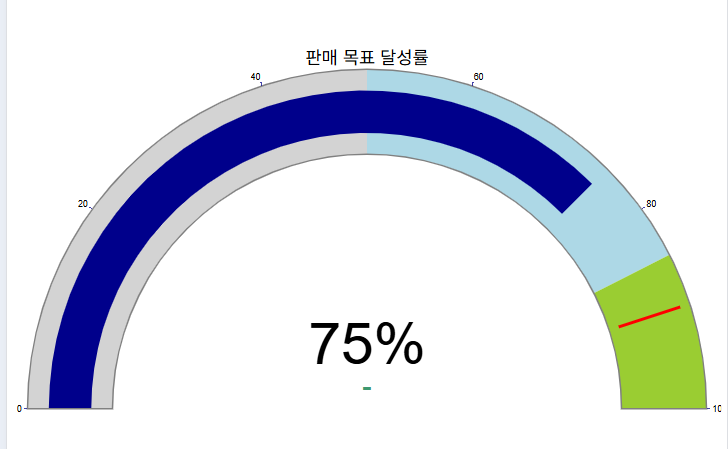
    Plotly를 사용한 게이지 차트 (Gauge Chart) 생성 예제 (Python Code)
"""

import plotly.graph_objects as go
import plotly.offline as pyo

# --- 게이지 차트 데이터 설정 ---
value = 75  # 현재 값 (예: 판매 목표 달성률 75%)
max_value = 100 # 최대 값
title_text = "판매 목표 달성률"
unit_text = "%"

# --- Plotly Indicator 객체 생성 ---
fig = go.Figure(go.Indicator(
    mode = "gauge+number+delta", # 게이지, 숫자, 델타(변화량)를 표시
    value = value,
    number = {'suffix': unit_text}, # 숫자 뒤에 단위 표시
    domain = {'x': [0, 1], 'y': [0, 1]},
    title = {'text': title_text, 'font': {'size': 24}},

    # --- 게이지 설정 ---
    gauge = {
        'shape': "angular", # 게이지 모양 (angular: 원형, bullet: 수평 막대)
        'axis': {'range': [None, max_value], 'tickwidth': 1, 'tickcolor': "darkblue"},
        'bar': {'color': "darkblue"}, # 현재 값 막대의 색상
        'bgcolor': "white",
        'borderwidth': 2,
        'bordercolor': "gray",

        # --- 구간별 색상 설정 (Thresholds) ---
        'steps': [
            {'range': [0, 50], 'color': "lightgray"},   # 0% ~ 50%
            {'range': [50, 85], 'color': "lightblue"},  # 50% ~ 85%
            {'range': [85, 100], 'color': "yellowgreen"} # 85% ~ 100% (목표 근접/달성)
        ],

        # --- 목표선 설정 (Threshold) ---
        'threshold': {
            'line': {'color': "red", 'width': 4},
            'thickness': 0.75, # 목표선의 두께
            'value': 90 # 목표 값 (예: 90%)
        }
    }
))

# --- 레이아웃 설정 ---
fig.update_layout(
    paper_bgcolor = "white", # 배경 색상
    font = {'color': "black", 'family': "Arial"},
    margin = dict(l=20, r=20, t=50, b=20) # 여백 설정
)

# --- 차트 출력 (브라우저에서 확인) ---
# pyo.plot(fig, filename='gauge_chart.html')

# --- (선택 사항) Notebook 환경에서 출력 ---
fig.show()'프로그래밍 > Python' 카테고리의 다른 글
| [python] turtle F11 Draw (0) | 2025.11.12 |
|---|---|
| [python] asciichartpy - 터미널(콘솔) 환경에 깔끔하고 읽기 쉬운 텍스트 기반의 ASCII 아트 그래프를 그려주는 라이브러리 (0) | 2025.10.22 |
| [PYTHON] Python 3.14.0 정식 버전 출시 🐍 (0) | 2025.10.13 |
| [PYTHON] ASCII 배너 생성 프로그램 (Python Code) (0) | 2025.10.01 |
| [python] Faker 라이브러리로 Dummy 데이터 만들기 (0) | 2025.09.25 |


