반응형
[python] Scatter plot animated using python, ffmpeg
"""
An animated scatter plot can be created using Python's matplotlib library with its animation module.
Here's an example of how to create an animated scatter plot, where points move dynamically over time.
"""

import numpy as np
import matplotlib.pyplot as plt
from matplotlib.animation import FuncAnimation

# Generate random initial data for the scatter plot
num_points = 50
x_data = np.random.rand(num_points)
y_data = np.random.rand(num_points)
colors = np.random.rand(num_points)
sizes = np.random.rand(num_points) * 100

# Function to update scatter plot
def update(frame):
    global x_data, y_data
    x_data += (np.random.rand(num_points) - 0.5) * 0.1  # Randomly move x
    y_data += (np.random.rand(num_points) - 0.5) * 0.1  # Randomly move y
    scatter.set_offsets(np.c_[x_data, y_data])  # Update positions
    scatter.set_sizes(np.random.rand(num_points) * 100)  # Update sizes
    scatter.set_array(np.random.rand(num_points))  # Update colors
    return scatter,

# Create the figure and scatter plot
fig, ax = plt.subplots()
scatter = ax.scatter(x_data, y_data, c=colors, s=sizes, cmap='viridis', alpha=0.6)
ax.set_xlim(0, 1)
ax.set_ylim(0, 1)
ax.set_title("Animated Scatter Plot")

# Create animation
ani = FuncAnimation(fig, update, frames=100, interval=50, blit=True)

# Show the animation
plt.show()

import matplotlib.animation as animation
animation.FFMpegWriter = animation.writers['ffmpeg']

"""
Install FFmpeg: FFmpeg is required to save animations in video formats like .mp4. Install it as follows:

Windows:

Download the FFmpeg executable from https://ffmpeg.org/download.html.
Add the bin folder to your system’s PATH environment variable.

1.EXE  파일 다운받아서  *.7z 파일 다운로드.

2.압축 풀고,  시스템 환경 변수에 추가.

3.  ffmpeg -version  으로 실행되는지 확인

"""

ani.save("animated_scatter.mp4", writer="ffmpeg", fps=30)  # Save as MP4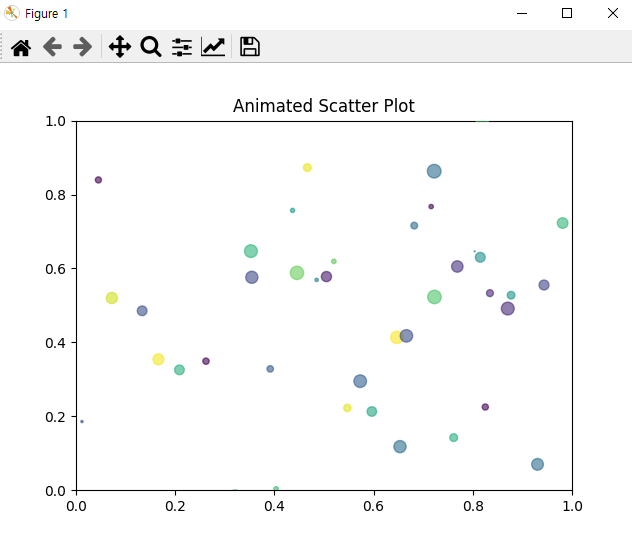
반응형
'프로그래밍 > Python' 카테고리의 다른 글
| [python] Django 설치, 설치 확인 (0) | 2025.01.22 |
|---|---|
| [python] 파이썬 가상환경 , 프로젝트 이식성, 패키지 목록 저장, 설치 (1) | 2025.01.22 |
| [python] 정렬 알고리즘 실행 시 비용 계산은 보통 실행 시간(시간 복잡도)이나 작업 횟수를 측정 (0) | 2025.01.15 |
| [python] Happy New year 2025 loop (0) | 2024.12.30 |
| [python] Merry christmas Tree (0) | 2024.12.24 |